Production Throughput Model
An Excel-based root cause analysis to identify drivers of production downtime and optimize bottling line efficiency using Power Query and Pareto analysis.
The Analytical Process (DMAIC Framework)
ETL & Data Transformation (Define & Measure)
Leveraged Power Query to merge disparate data sources into a unified fact table.
- Unpivoted 12 columns of downtime factors into a "tall" schema
- Cleaned production records for consistency across shifts
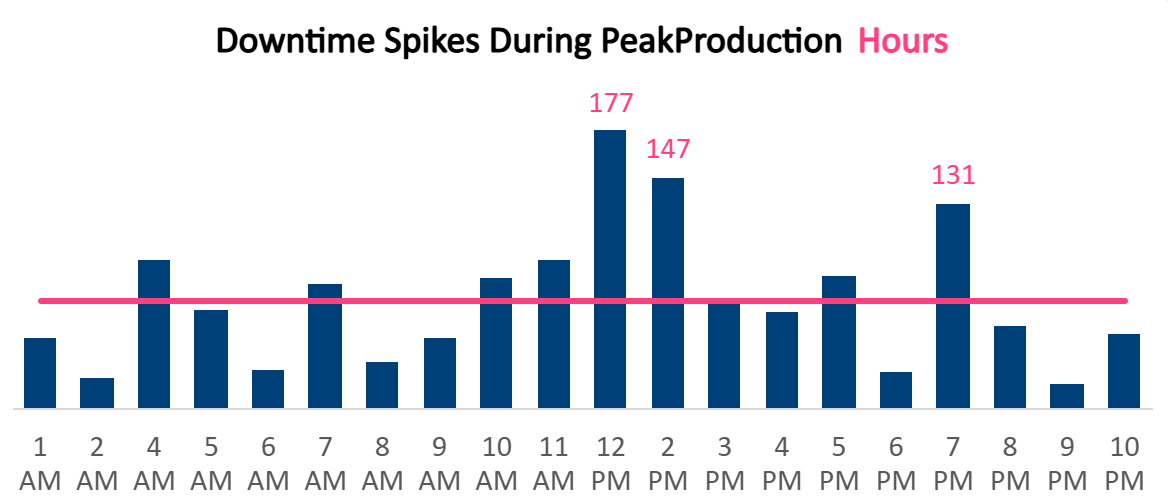
- Calculated efficiency metrics considering overnight overlaps
Down-Time Segmentation (Analyze)
Partitioned downtime into "Operator-Controllable" and "Systemic" categories to ensure fair performance assessment.
Root Cause Identification (Improve & Control)
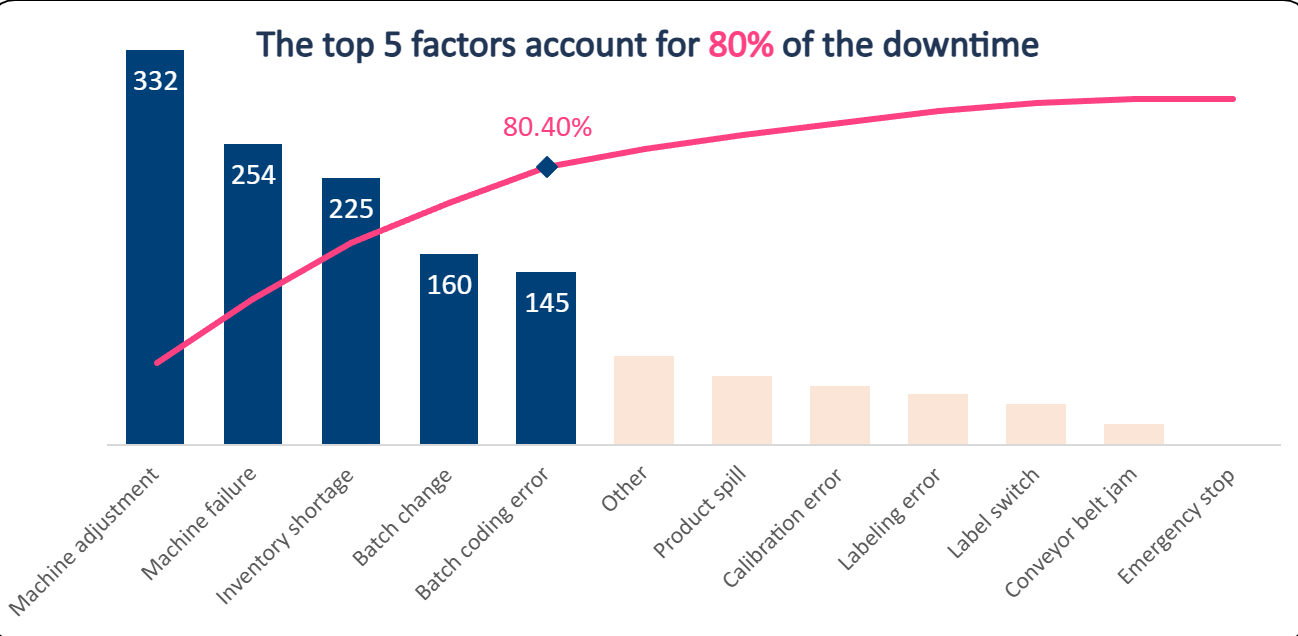
Deployed Pareto analysis to isolate the "Vital Few" factors—specifically machine failure and inventory shortages—that drove 80% of lost time.
Downtime Drivers
Identified that Machine Adjustments and Inventory Shortages were the primary bottlenecks, not operator speed.
Productivity Levers
The CO-600 product line demonstrated the highest variance in downtime, suggesting equipment issues specific to that format.
Technical Toolkit
Strategic Recommendation
"Shift from reactive machine fixing to a preventative maintenance schedule prioritized for the CO-600 line equipment and high-incidence adjustment phases."
Github RepositorySupporting Visuals