Service Quality Analytics
> Translating airline survey data into actionable service enhancements through Power BI segmentation.
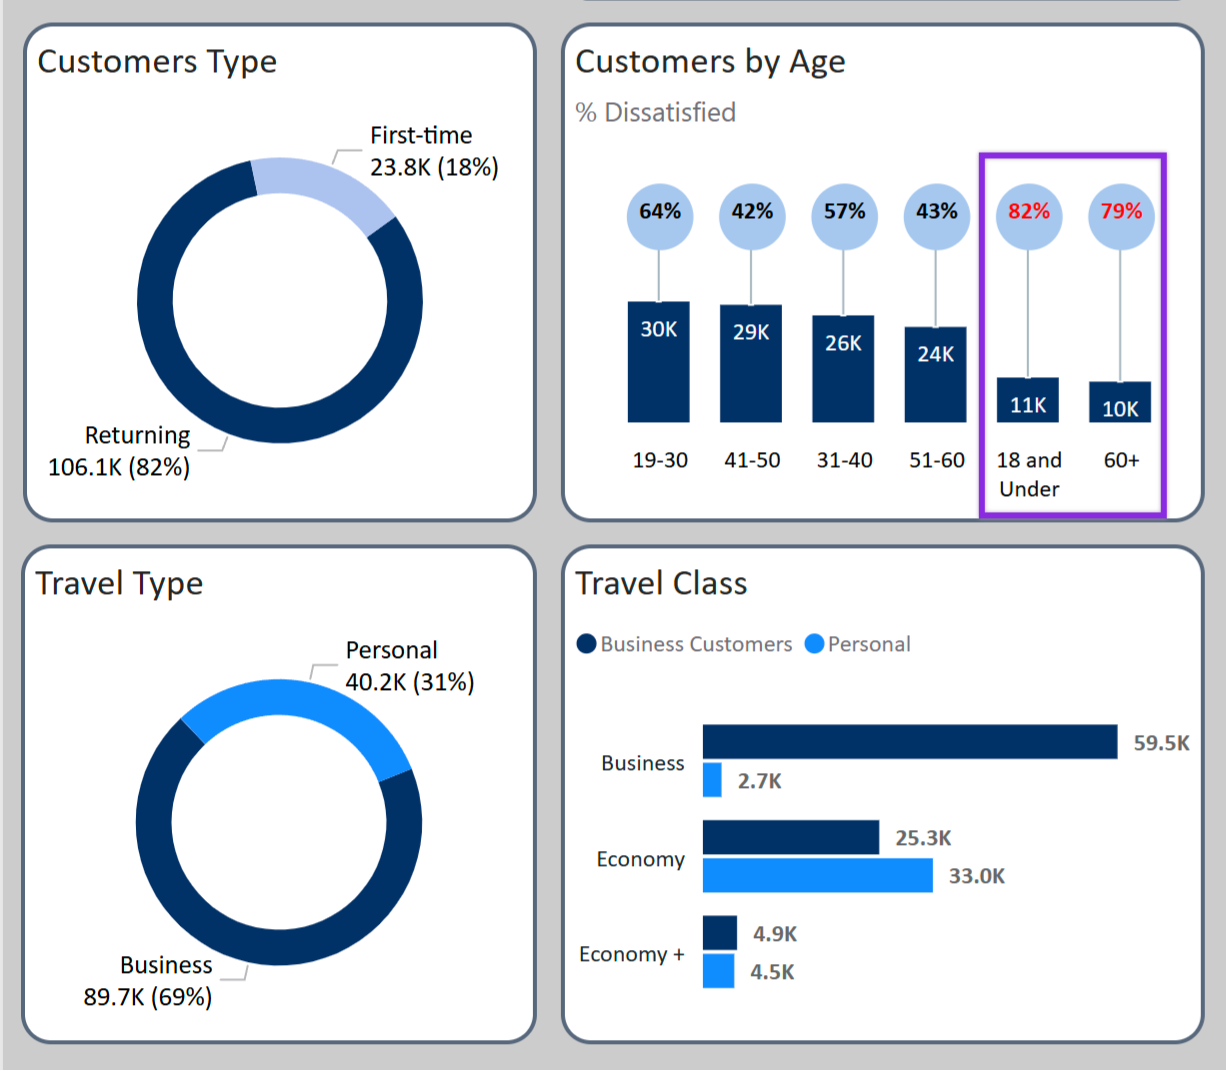
Business Travel
70%
Volume Share
Dissatisfaction
70%
First-time Flyers
Top Driver
In-Flight
Service & Comfort
Recall Focus
Wi-Fi
Primary Pain Point
Interactive Intelligence
The Analytical Process
Power Query Transformation
Redesigned raw survey data into a usable star schema. Normalized Likert scale responses and handled null values in baggage and flight delay columns to ensure statistical integrity.
Comparative Segmentation
Executed a deep dive into traveler demographics. Isolated Business class vs. Personal Eco passengers to understand how price sensitivity affects perceived service quality.
Root Cause Identification
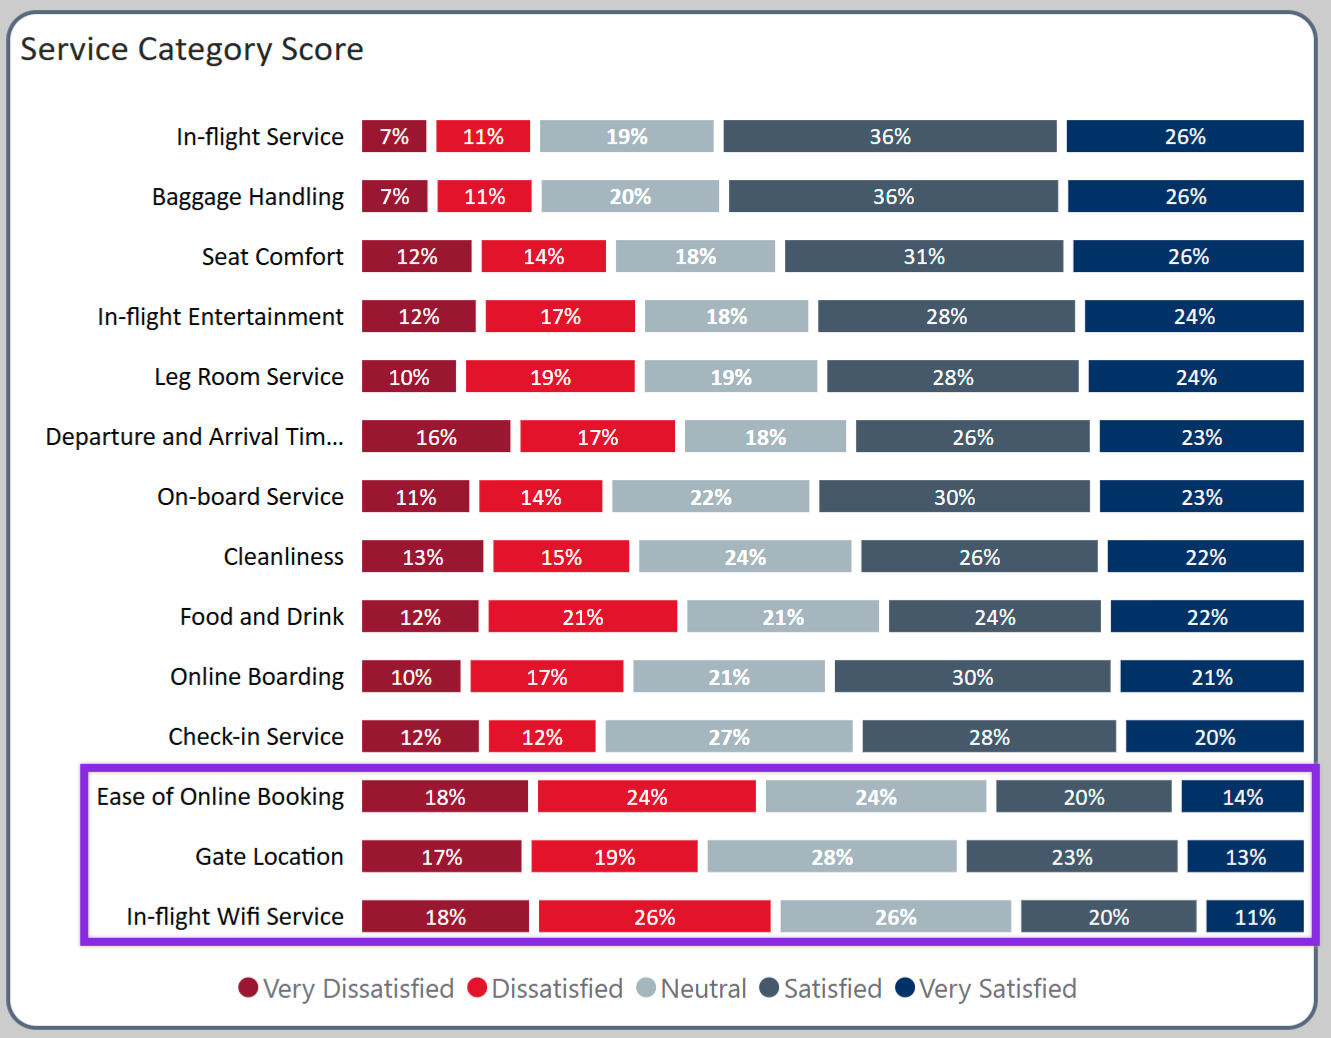
Utilized correlation analysis to identify that "Ease of Online Booking" and "In-flight Wi-Fi" were the primary drivers of negative sentiment, despite high comfort scores.
Service Strategy
- • Implement tiered Wi-Fi pricing to improve bandwidth for business users.
- • Targeted onboarding emails for first-time travelers to reduce 70% dissatisfaction.
Digital Optimization
- • Redesign online booking UX to reduce friction points found in survey data.
- • Deploy real-time airport navigation features in the mobile app.
Technical Toolkit
Impact Summary
Translated survey sentiments into a prioritized technical roadmap. Identified that Wi-Fi reliability remains the #1 bottleneck for the airline's most valuable customer segment (Business Travelers).
Github RepositoryVisual Evidence
Demographics
Satisfaction by Passenger Profile
Sentiment Analysis
Likert Scale Service Distribution